-
this articles dissects the art of comedy and distills it down to a few "joke templates". [via Mind Hacks]
-
"a musical realization of the motion graphics of john whitney as described in his book 'digital harmony'." By Jim Bumgardner. Play with the hand crank!
-
Flickr Hacks co-author Jim Bumgardner recently spoke at Yahoo about the visual and audio hacks he plays around with. I hope Yahoo releases audio of his talk.
-
[via Bruce Schneier]
-
some of the presentations from the IDEA conference are available now
-
I already ordered the book. (It arrived today, yay!) But I'd be ordering on Nov. 1st with others if I hadn't. [via Brian Sawyer]
October 2006
-
Six Apart's social blogging platform Vox has been released to the public today. Its combination of public and private spaces based on friend networks makes it sorta like LiveJournal for the rest of us.
-
nice add-on for WordPress that lets you quickly jump to admin stuff like editing posts.
-
Ev starts a new chapter
-
Using a bunch of Amazon metrics to track the popularity of game systems. [via AWS blog]
Graphing for Mortals
A month or so ago I was at the Future of Web Apps conference listening to Cal Henderson talk about lessons he's learned from building Flickr. (You can snag audio of his talk and his powerpoint slides at the FOWA site.) One of his slides mentioned graphing the hell out of everything so you can get a visual sense of what's happening with your application. He mentioned Cacti as a great app for visualization. I took a look at it, but it looked so complex that I dismissed it as a tool for large-scale apps.
I manage a very small setup with a couple of servers. But I've never been able to get a good "snapshot" of what's happening. I've been relying on server logs (analyzed with analog) and Google Analytics. Analog does nice text reporting, but isn't strong on graphs. And Google Analytics is always a couple days behind. My ISP doesn't offer bandwidth usage reports, and I've had to take their word on usage. So I completely understand Cal's point about getting a handle on what's happening on your servers.
When I got back from SF, I decided to bite the bullet and learn how to graph this stuff. And after a month or so, I finally have some nice graphs giving me a better sense of what's happening on my servers right now. I thought I'd share my personal crash course in graphing stuff, in case anyone else out there manages their own servers and doesn't have a web ops department.
Step 1: Learn RRDtool. heh, well, at least get to the point where you understand what round-robin databases are and how to create graphs from that data. I knew I'd read about RRDtool somewhere before, and sure enough Hack #62 in Spidering Hacks is called Graphing Data with RRDtool. It showed how to graph the Amazon sales rank of a book over time. I followed the example, and then tweaked it a bit to track books I'm interested in. I came up with this:
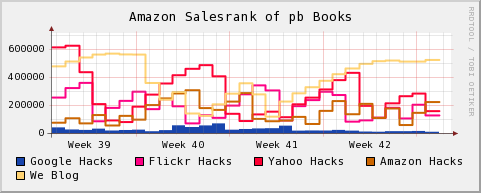
Lower is better on this graph.
So on a daily basis I can see how the books I've helped put together are doing on Amazon, and then step back and get the view over several weeks. (Not always a good thing.) I also put together graphs of individual books, plotted a couple books together, and generally learned how to control RRDtool graphs a little. Knowing a bit about RRDtool helps a ton once you get to step 3.
(And speaking of books, I really wanted a book about graphing with RRDtool at this point. It seems that whenever I want to tackle a technology that is new to me, I want to run away from my computer and sit down somewhere with a book—coming back to the computer armed with more info. There aren't any books specifically about RRDtool, and I think a great PDF that explains some of the high-level concepts would be an improvement over the current documentation that focuses on walk-throughs.)
Step 2: Learn SNMP. Again, impossible to tackle in a few days, but you can get the gist of it fairly quickly. SNMP is a protocol for monitoring network equipment. I grabbed Net-SNMP and followed the tutorials for configuring it. I especially found the tool snmpwalk helpful for making sure everything was up and running properly.
I should probably pick up Essential SNMP. I looked at it in a bookstore, and quickly scanned the chapter about RRDtool and Cricket. I realized that I should be using a front-end for creating graphs instead of hand-coding monster RRDtool command lines. Which led me to...
Step 3: Install Cacti. Cacti is a PHP/MySQL application for generating graphs with RRDtool and SNMP. You can use some built-in templates for tracking network usage, or create your own data sources with some simple scripts. Once you see how tedious it is to create your own RRDtool graphs, you'll appreciate how quickly you can build graphs with Cacti.
I'm running Cacti on Windows, and it took a while to get everything configured properly. Here are some essential tips that I picked up from the forums if you're in the same boat:
There's also a bunch of data sources and graph templates that the Cacti users share in the forums. Take a look at this post: Complete List of Cacti Scripts and Templates to get a sense of what's available. I plugged in a WMI SQL Server monitor, and it just worked without much fiddling around.
I also recommend running the app in debug mode. As you create graphs, take a look at the RRDtool commands that generate the graphs. You'll start to get a better feel for RRDtool simply through osmosis. And if you took the time to learn about RRDtool in Step 1, seeing the raw commands helps you diagnose problems with your graphs.
So what I've ended up with after all of this work is a page filled with pretty graphs like this, giving me a look at what's happening on my servers and my sites in real time:
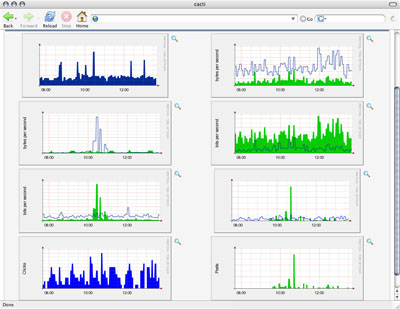
These graphs have been scrubbed a bit.
I'm just beginning my data visualization journey, but I can already tell this going to help me make decisions going forward. (Thanks, Cal!) There's something about seeing information in a graph that makes it more concrete than numbers flowing by in a log. This step into the arcane world of network graphing already has me thinking about the real world differently. I'm walking around looking at things thinking, "I could graph that!"
I manage a very small setup with a couple of servers. But I've never been able to get a good "snapshot" of what's happening. I've been relying on server logs (analyzed with analog) and Google Analytics. Analog does nice text reporting, but isn't strong on graphs. And Google Analytics is always a couple days behind. My ISP doesn't offer bandwidth usage reports, and I've had to take their word on usage. So I completely understand Cal's point about getting a handle on what's happening on your servers.
When I got back from SF, I decided to bite the bullet and learn how to graph this stuff. And after a month or so, I finally have some nice graphs giving me a better sense of what's happening on my servers right now. I thought I'd share my personal crash course in graphing stuff, in case anyone else out there manages their own servers and doesn't have a web ops department.
Step 1: Learn RRDtool. heh, well, at least get to the point where you understand what round-robin databases are and how to create graphs from that data. I knew I'd read about RRDtool somewhere before, and sure enough Hack #62 in Spidering Hacks is called Graphing Data with RRDtool. It showed how to graph the Amazon sales rank of a book over time. I followed the example, and then tweaked it a bit to track books I'm interested in. I came up with this:
Lower is better on this graph.
So on a daily basis I can see how the books I've helped put together are doing on Amazon, and then step back and get the view over several weeks. (Not always a good thing.) I also put together graphs of individual books, plotted a couple books together, and generally learned how to control RRDtool graphs a little. Knowing a bit about RRDtool helps a ton once you get to step 3.
(And speaking of books, I really wanted a book about graphing with RRDtool at this point. It seems that whenever I want to tackle a technology that is new to me, I want to run away from my computer and sit down somewhere with a book—coming back to the computer armed with more info. There aren't any books specifically about RRDtool, and I think a great PDF that explains some of the high-level concepts would be an improvement over the current documentation that focuses on walk-throughs.)
Step 2: Learn SNMP. Again, impossible to tackle in a few days, but you can get the gist of it fairly quickly. SNMP is a protocol for monitoring network equipment. I grabbed Net-SNMP and followed the tutorials for configuring it. I especially found the tool snmpwalk helpful for making sure everything was up and running properly.
I should probably pick up Essential SNMP. I looked at it in a bookstore, and quickly scanned the chapter about RRDtool and Cricket. I realized that I should be using a front-end for creating graphs instead of hand-coding monster RRDtool command lines. Which led me to...
Step 3: Install Cacti. Cacti is a PHP/MySQL application for generating graphs with RRDtool and SNMP. You can use some built-in templates for tracking network usage, or create your own data sources with some simple scripts. Once you see how tedious it is to create your own RRDtool graphs, you'll appreciate how quickly you can build graphs with Cacti.
I'm running Cacti on Windows, and it took a while to get everything configured properly. Here are some essential tips that I picked up from the forums if you're in the same boat:
- Enable the SNMP and sockets extensions in php.ini.
- Disable strict mode in MySQL's my.ini.
- Use Cacti-approved builds of RRDtool.
- Stroll through the Cacti db to get a sense of what's happening.
- The Cacti log file is useful. Go there first if you're having a problem.
There's also a bunch of data sources and graph templates that the Cacti users share in the forums. Take a look at this post: Complete List of Cacti Scripts and Templates to get a sense of what's available. I plugged in a WMI SQL Server monitor, and it just worked without much fiddling around.
I also recommend running the app in debug mode. As you create graphs, take a look at the RRDtool commands that generate the graphs. You'll start to get a better feel for RRDtool simply through osmosis. And if you took the time to learn about RRDtool in Step 1, seeing the raw commands helps you diagnose problems with your graphs.
So what I've ended up with after all of this work is a page filled with pretty graphs like this, giving me a look at what's happening on my servers and my sites in real time:
These graphs have been scrubbed a bit.
I'm just beginning my data visualization journey, but I can already tell this going to help me make decisions going forward. (Thanks, Cal!) There's something about seeing information in a graph that makes it more concrete than numbers flowing by in a log. This step into the arcane world of network graphing already has me thinking about the real world differently. I'm walking around looking at things thinking, "I could graph that!"
-
a hyperlocal blog/news aggregator headed by Steven Johnson [via kottke], with some thoughts about the project from SBJ: Introducing outside.in.
-
internal documents from the National Park Service that detail how to develop National Park activities, interpretive media, and "informal" dialogue. [via sterling via IDEA]
Update 2: huh, maybe it's just me. MojoMark was able to grab a copy of the site for me.
-
John Battelle has a great idea about storing data in info-privacy friendly countries. But I'd go a step further and say that big data stores should also store data in an encrypted format, so only someone with a key can make the data useful.
-
put in some text, and see if this script can guess the author's gender based on word usage. (I was looking for a Perl module that does this, but no luck.)
The Former Audience in Meatspace
I love museums, and I'd like to see them become more like the Web. After "living" on the Web day in and day out for years, any space that isn't as interactive, customizable, and "deep" as the Web is a bit frustrating to me.
This realization occurred to me a few months ago at the High Desert Museum in Bend, Oregon. It's a fantastic museum that has exhibits about the local art, history, and culture of the Bend area, Oregon, and the West in general. I'd been to the museum several times before, so I'm fairly familiar with their permanent exhibits. One is called Spirit of the West and includes recreations of pioneer camps, mines, ranches, and towns. These life-size dioramas are filled with antique equipment, and enhanced with audio and lighting. And there's quite a bit of text along the way printed on plaques to explain each of the scenes. It's all very well done.
On this particular trip, we were just about to enter the Spirit of the West when a tour guide stopped us to let us know he was about to lead a group through. So we waited and joined the tour. The guide brought another level of detail to the exhibit. So even though I'd been through the exhibit before, I was learning all sorts of new things. The tour guide could point to a specific item within the exhibit and riff on that for a bit. (Did you know that early trappers used bricks of tea instead of tea leaves like we use today?) The tour guide relayed stuff that wouldn't make it onto the official wall text describing the exhibits, but the extra layer of information helped bring the scene to life.
The tour included a stop at a recreation of an 1800's store run by Chinese immigrants. As you step inside you see lots of stuff that would have been for sale at a store like this, Chinese newspapers and inventory lists from the period, and an audio track playing with people speaking Chinese. Someone in the group asked what the people were saying on the audio track, and the tour guide launched into a story. It turns out he'd had several Chinese speakers on previous tours, and he'd started to piece together what the audio was. Apparently, the museum curators had recorded a mahjong game in progress, and audio in the store was simply some people sitting around playing a game and having a conversation. Most museum-goers in Bend, Oregon would never know what exactly the conversation was about, so it didn't matter that the audio didn't faithfully recreate an 1800's Chinese store.
I was struck by this little exchange, because the tour guide had gone from adding a layer about the exhibit to a little behind-the-scenes information about the construction of the exhibit. And the information hadn't come from the museum curators, it had come from fellow museum-goers.
Along the way, I noticed other types of information the guide was relating such as trends. He'd say, "everyone always asks about this piece of equipment right here." And then he'd explain what that was. He was using audience patterns to tune his presentation.
So the tour guide had three different types of knowledge he was passing on: 1.) extended information about exhibits from the museum, museum-goers, and his own scholarship. 2.) Behind-the-scenes information about the construction of exhibits. 3.) Trends that he's noticed in the behavior of museum-goers. And I thought that the tragedy of this is that all of this knowledge vanishes when he's not around. In fact, I'd been to the museum several times and hadn't hit this vein of information. With this info, the museum was a completely different experience.
Another great exhibit at the High Desert Museum gives a history of the U.S. Forest Service from its earliest days to the present. It delves into the changes in technology over the years, their achievements, and even the personal lives of the people serving. I know that members of the U.S. Forest Service must love this exhibit and visit frequently, and each of them must have their own information they could add about specific artifacts or events depicted.
Ever since this visit I've been wondering how museums (and other offline spaces) can move from a broadcast model to an "information hub" model. Why not set up kiosks to let visitors record their memories, opinions, and observations via video, audio, and text? All of this information gathering can be done in a browser now, so a kiosk wouldn't need to be expensive custom hardware with custom software. Why not let the museum curators filter through the audience submissions and highlight the best? Why not give interested visitors information about the "making of" certain exhibits. And there must be a way to expose which exhibits are most popular, and which are most popular among certain demographics. How about "best of" lists by other museum-goers?
I'm used to being in spaces that want to hear my take on things. Companies are competing for user-generated content, and those sites that give voices to their users are some of the most visited online. Journalists are starting to realize that their audience collectively knows more about a topic than they do. Sites want to personalize experience so that people get the most out of their visits. People turn to their online social networks to find/sort/filter data on a regular basis. I hope these trends move out to museums, and into meatspace in general.
-
15 ideas for saving newspapers. (hint: it's not about 'reenergizing readers'.) [via mathowie]
-
Not that I would have a need for this or anything. But if I did, these would be great instructions.
Paul ego surfing
Hey, this site is the fourth result on Google when you search for Paul. I'm situated behind Paul Graham, Paul McCartney, and DePaul Univeristy. I know because I heard from the fifth Paul on the list—Paul Stamatiou—who found me via Google. (I'd link to them, but I don't want to add to their Paulrank values.) I'm expecting an email from Paul Harvey (10th on the list) any day now.
-
Easy-to-install version of GPG for Mac folk.
-
I just tried Enigmail again after a couple years, and it actually works well. This plugin handles encrypting/decrypting email on the fly. (If you have GnuPG installed.)
-
"Marine scientists say archaeological remains discovered 36 metres (120 feet) underwater in the Gulf of Cambay off the western coast of India could be over 9,000 years old." [via sterling]
-
rael and michael's startup has a blog now.
-
Valid criticism of the official Google Blog's headlines, and good advice for any weblog author. Headlines are insanely important in the age of aggregation.
-
free VPN application [thanks, mathowie]
-
now you can talk like Mr. Burns! [via kottke]
-
This tutorial shows how to flash the drive firmware to remove software-imposed speed and region limitations.
-
Yet another site you can ping when you update your blog. This one's for Google's Blog Search. Ping!
-
Nice tutorial that shows how you can saturate the colors in a photo by switching to Lab Color mode and messing with the channels. [via nelson]
-
search for code in specific languages (except VB?) from across the web.
-
lectures from UC Berkeley classes online. [via Searchblog]
-
paper suggesting "decentralized governance and user accountability as a means of governing the Internet." [via craigblog]
-
Sounds like you can add some Google Homepage modules to any web page now
-
This talk at Google by Dan Frankowski shows you can identify people based on anonymous movie ratings if you have another non-anonymous set of related data. [via O'Reilly Radar]
-
"A 2005 report from the Pew Internet and American Life Project called 'Teens and Technology' found that teenagers preferred new technology, like instant messaging or text messaging, for talking to friends and use e-mail to communicate with 'old people.'" [via cameron]